
Put your monitoring tools behind one on-call agent
Connect Datadog, OpenSearch, Sentry, and PagerDuty by pasting an API key, then build an on-call agent that checks each of them in order when an alert fires.
When a 5xx alert fires, the on-call engineer starts opening tabs. Datadog for the monitor, Sentry for the stack trace, OpenSearch to dig up logs from the same window. Then GitHub, to see whether something just shipped.
If those tools are connected to one agent, you can hand that whole round of checks off in a sentence. Ask “what happened in the last hour?” and the agent queries each tool in turn and comes back with a summary, evidence attached. There is no code involved in connecting them. You paste the API key each service gives you into a form.
Good for teams that
- Flip between four or five dashboards every time an alert goes off
- Start each on-call handoff by asking “what’s firing right now?” all over again
- Use different monitoring tools for different services and have no single place to see them together
What you need
- An endue account and one agent
- An API key for each monitoring tool you want to connect. If the agent will only look things up, start with a read-only key
1. Connect your monitoring tools
- In the left rail, go to Abilities → Connectors and open the Discovery tab. Monitoring tools are grouped under Observability & Incidents.
- Pick a tool and endue first shows you what the agent will be able to do with it. When you’re happy, press Connect.
- Enter a connection name and the key, then press Connect. That’s it. Pick a name you’ll recognize later, like
Datadog · prod.
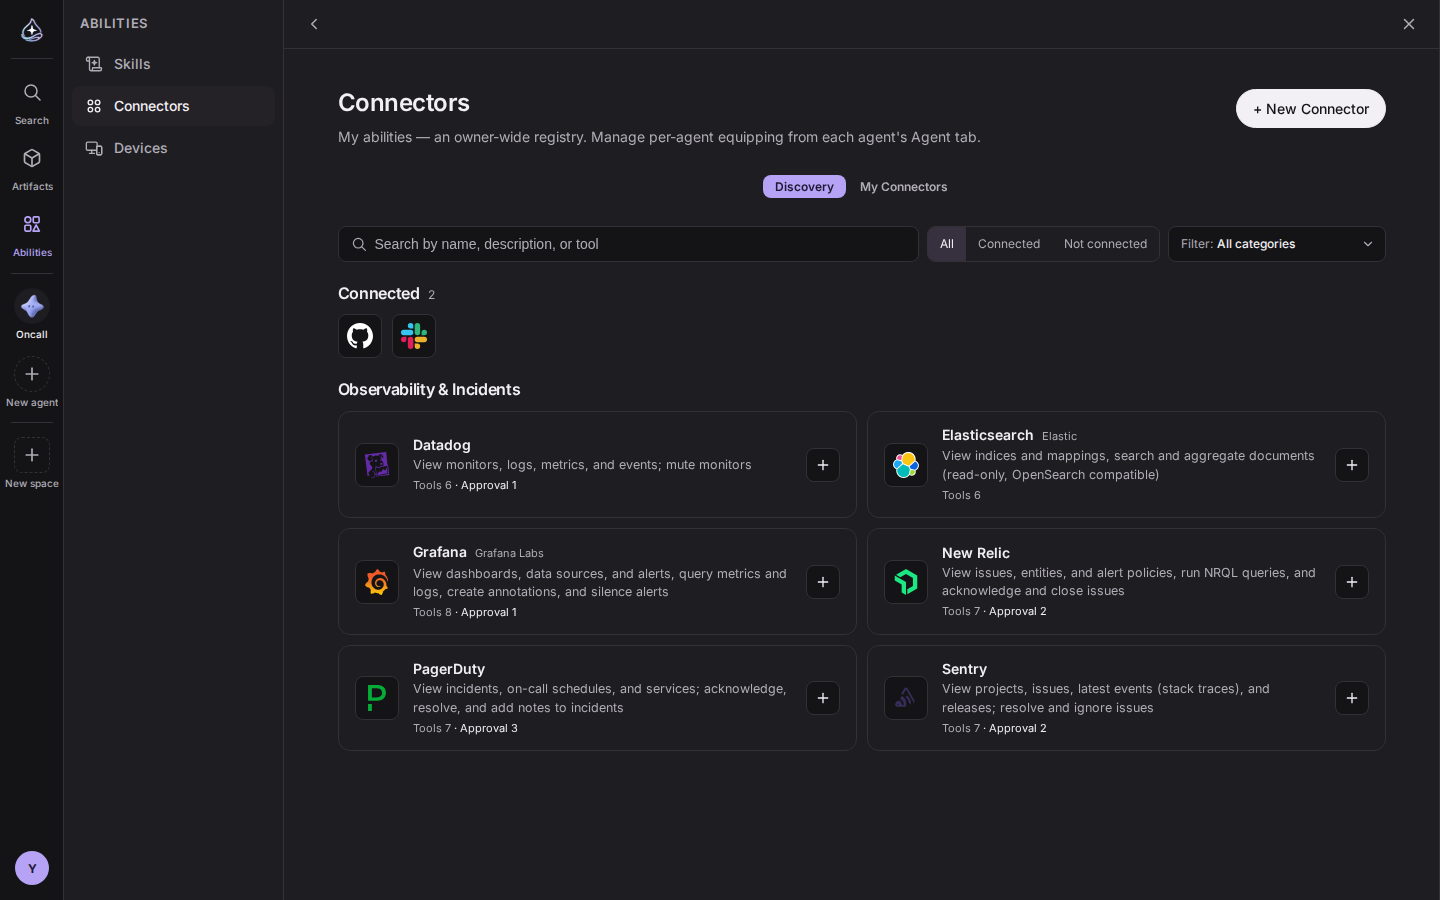
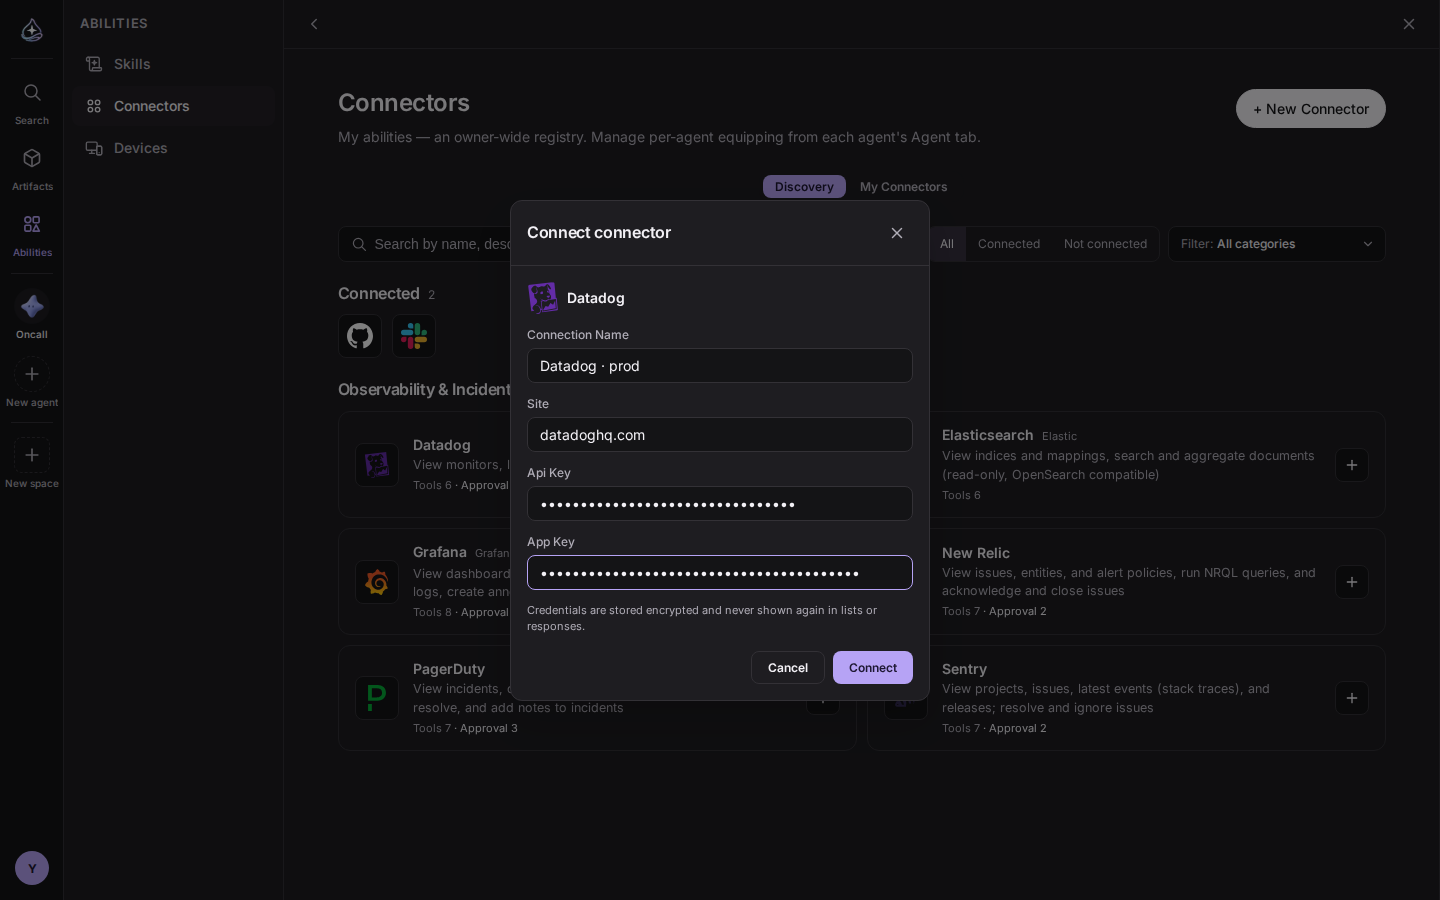
Here is what each form asks for.
- Datadog: site, API key, application key. For the site you can paste
app.datadoghq.comstraight from your browser’s address bar - Elasticsearch · OpenSearch: the cluster’s https URL and an API key
- Grafana: your Grafana URL and a service account token (starts with
glsa_) - Sentry: server URL (
https://sentry.iofor SaaS), organization slug, auth token - New Relic: region (
usoreu) and a USER-type API key (starts withNRAK-) - PagerDuty: API key and the account email that incident actions are recorded under
OpenSearch connects through the Elasticsearch connector. The search and aggregation APIs are the same, so queries work as they are. Authentication is API key only (
Authorization: ApiKey), though, so a cluster that only accepts a username and password can’t be connected yet.
GitHub and Slack connect with a sign-in instead of a key. You create a connection once on your account, and any of your agents can use it.
2. Attach them to the agent
Creating a connection doesn’t hand it to every agent. You decide, agent by agent, which tools it gets.
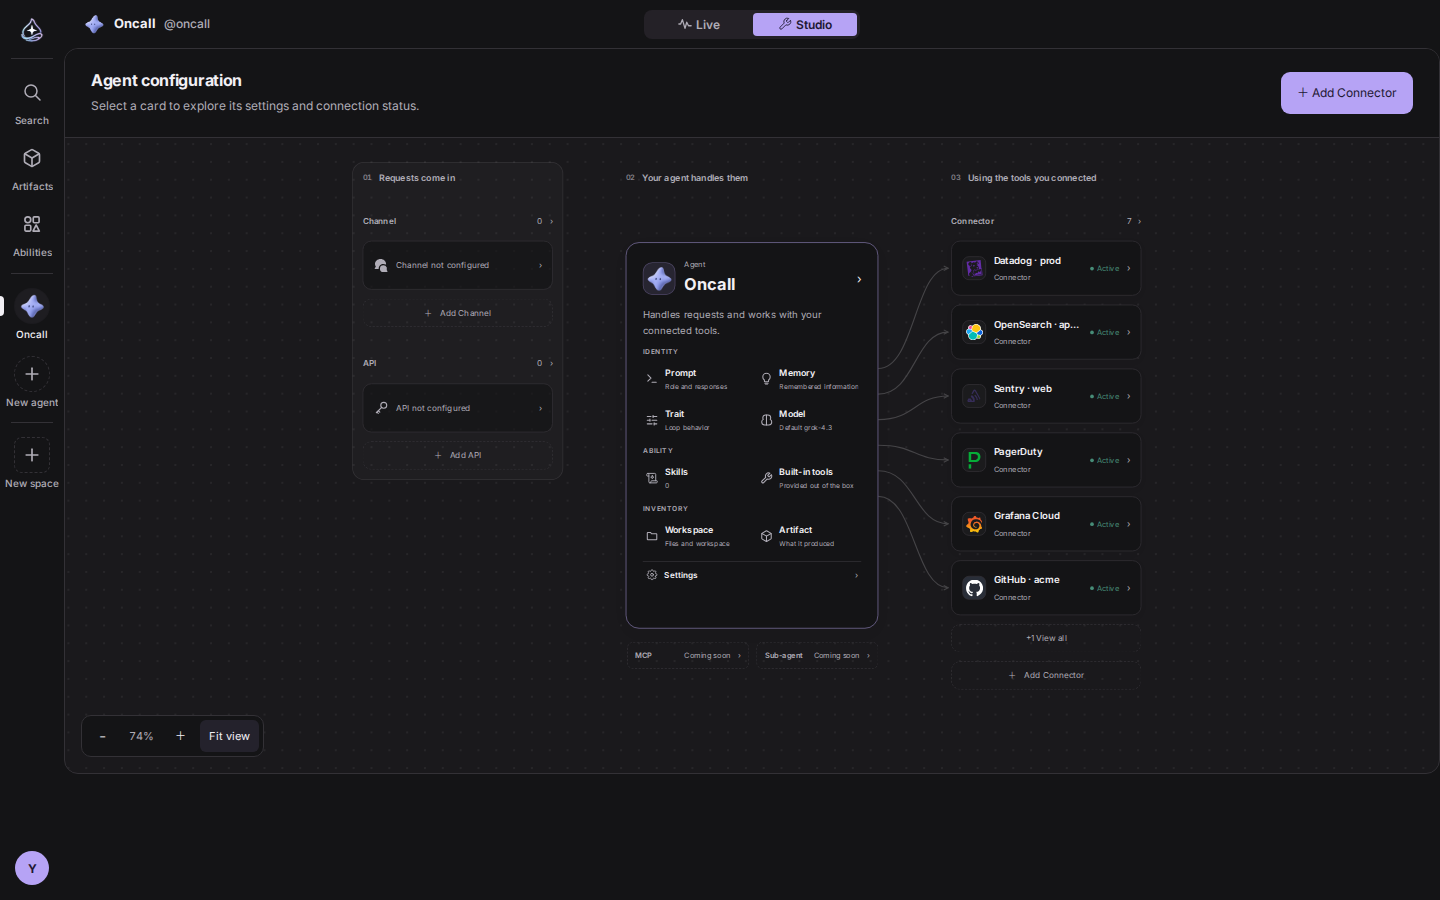
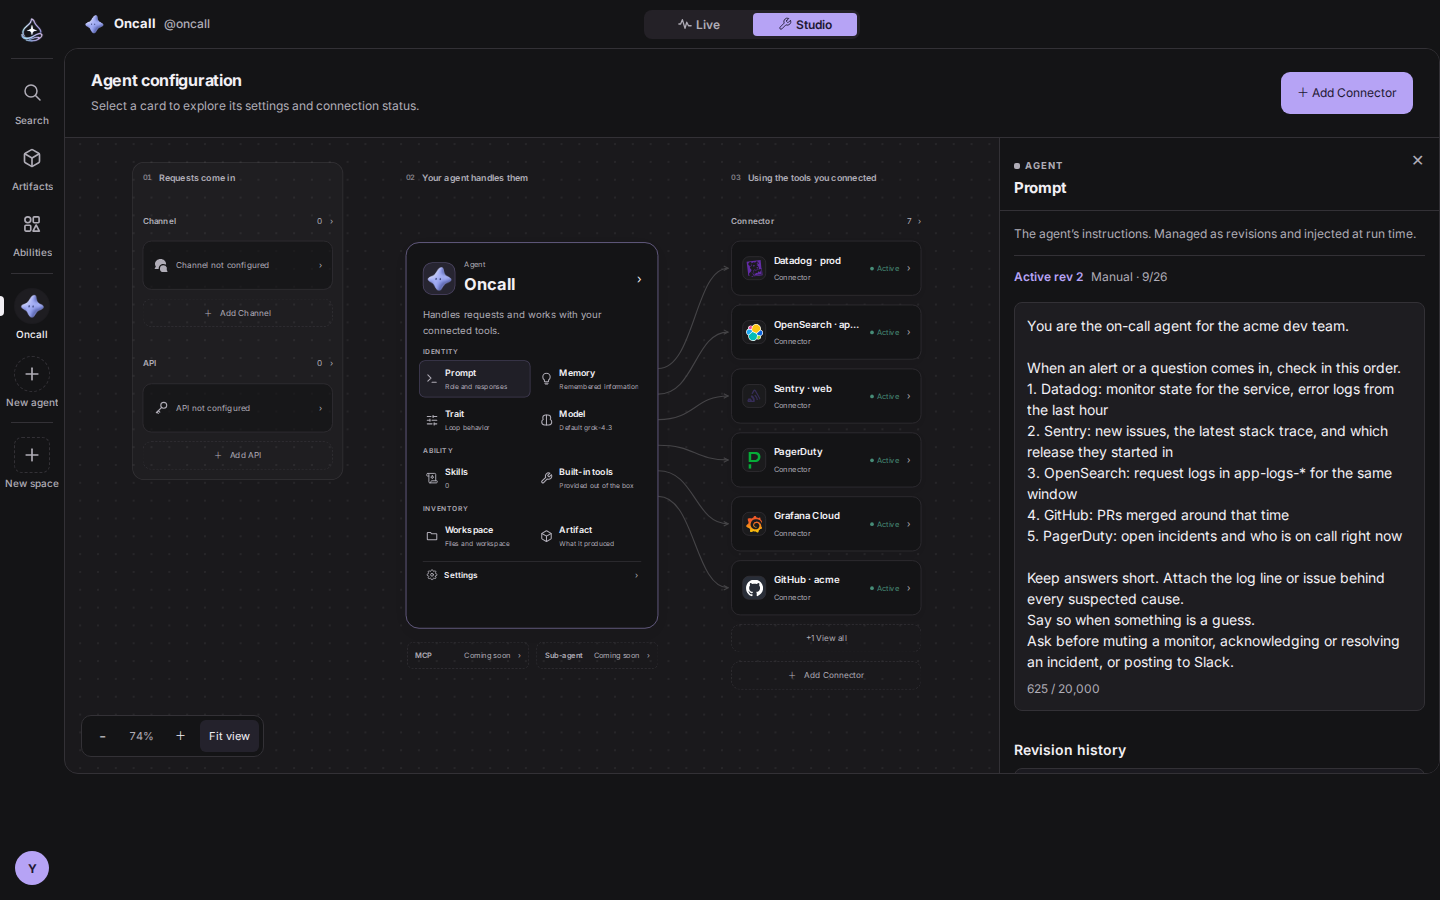
- Open the agent and switch to Studio at the top. The canvas lays out the whole agent on one screen.
- Press + Add Connector in the top right and pick the connections you just made from the My connectors tab. If a tool isn’t connected yet, you can connect it right there from the Catalog tab.
- Attached tools line up in the right-hand column of the canvas.
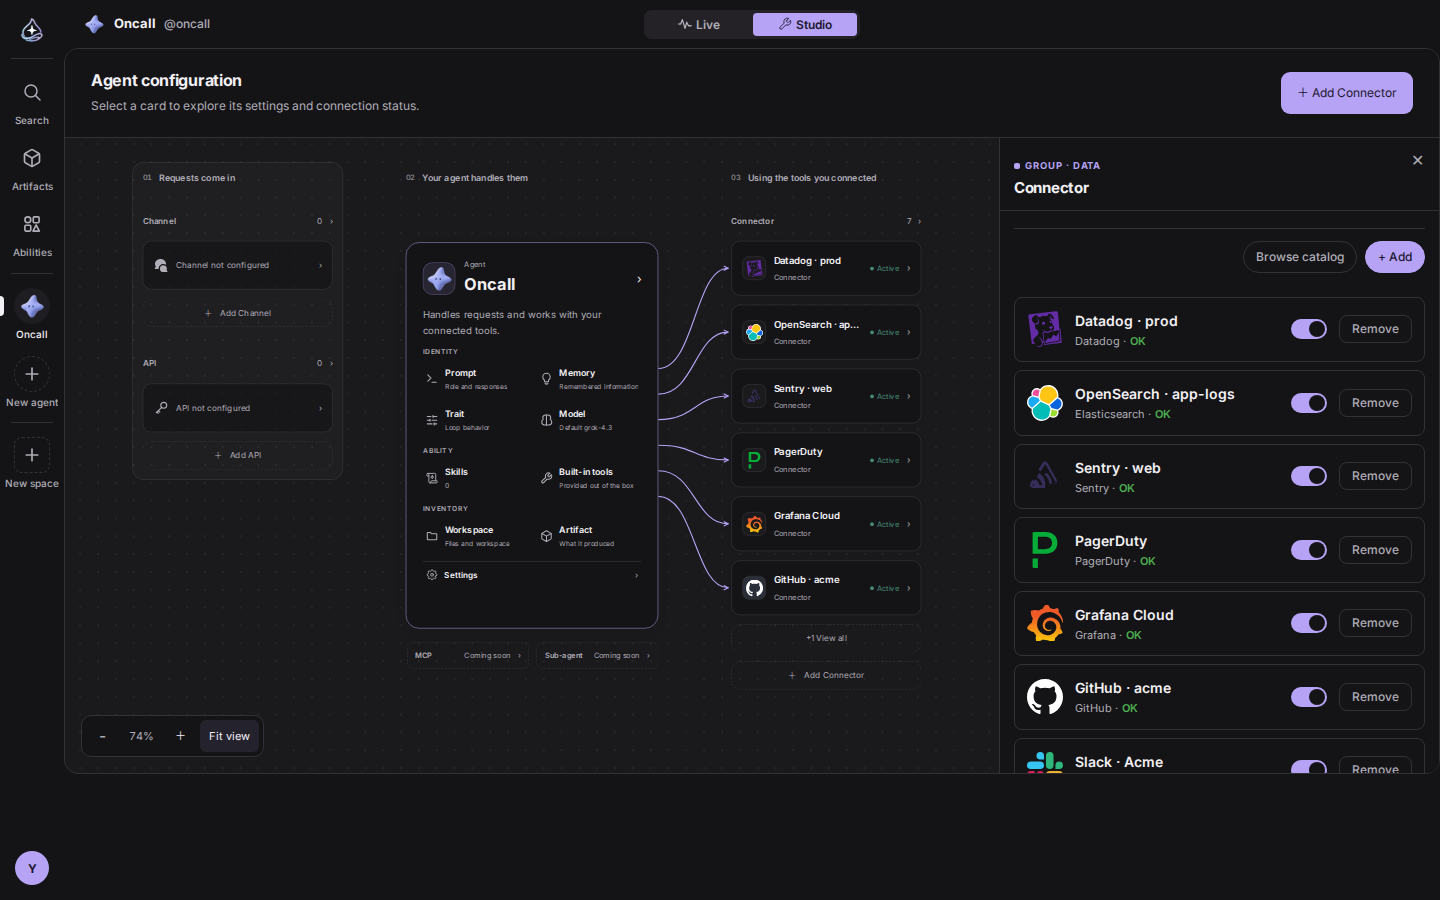
Click the connector column to open the list of connections on this agent. Each one shows its current status. Flip the switch to pause one, or press Remove to take it off. Either way it only affects this agent. The connection itself stays on your account.
3. Write the check order into the prompt
With tools attached, the agent already picks the right one for the question. Writing down the order your team actually follows makes the answers more consistent, though. We opened Prompt on the canvas and wrote this.
When an alert or a question comes in, check in this order.
- Datadog: monitor state for the service, error logs from the last hour
- Sentry: new issues, the latest stack trace, and which release they started in
- OpenSearch: request logs in app-logs-* for the same window
- GitHub: PRs merged around that time
- PagerDuty: open incidents and who is on call right now
Keep answers short. Attach the log line or issue behind every suspected cause. Ask before muting a monitor, acknowledging or resolving an incident, or posting to Slack.
Service names, index patterns, repo names: anything only your team would know is worth writing down. The agent will stop asking.
Use it
In chat, paste the alert as it came in or just ask.
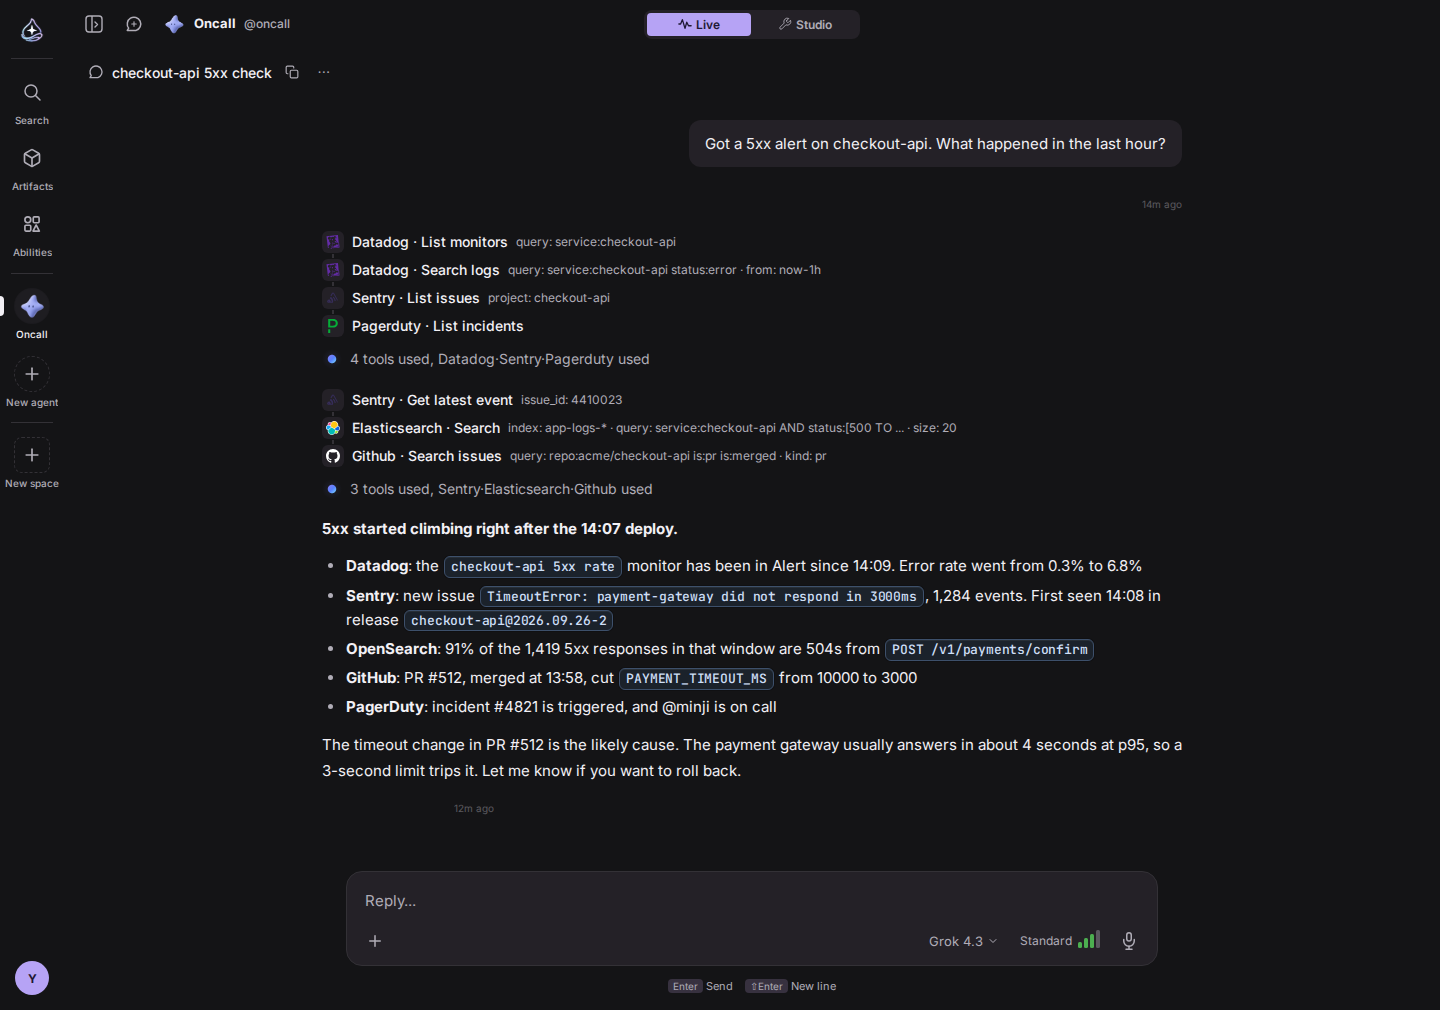
Got a 5xx alert on checkout-api. What happened in the last hour?
The agent sweeps Datadog, Sentry, and PagerDuty first, all at once. When something stands out, it narrows in with the Sentry stack trace, OpenSearch logs, and GitHub PRs. Every tool call and its arguments stay above the answer, so you can trace any conclusion back to where it came from.
Anything hard to undo, it asks first
Lookups run without asking. Actions that silence alerts or leave a trail the team will see bring up an approval card first. The card defaults to Cancel, so one stray Enter won’t run anything.
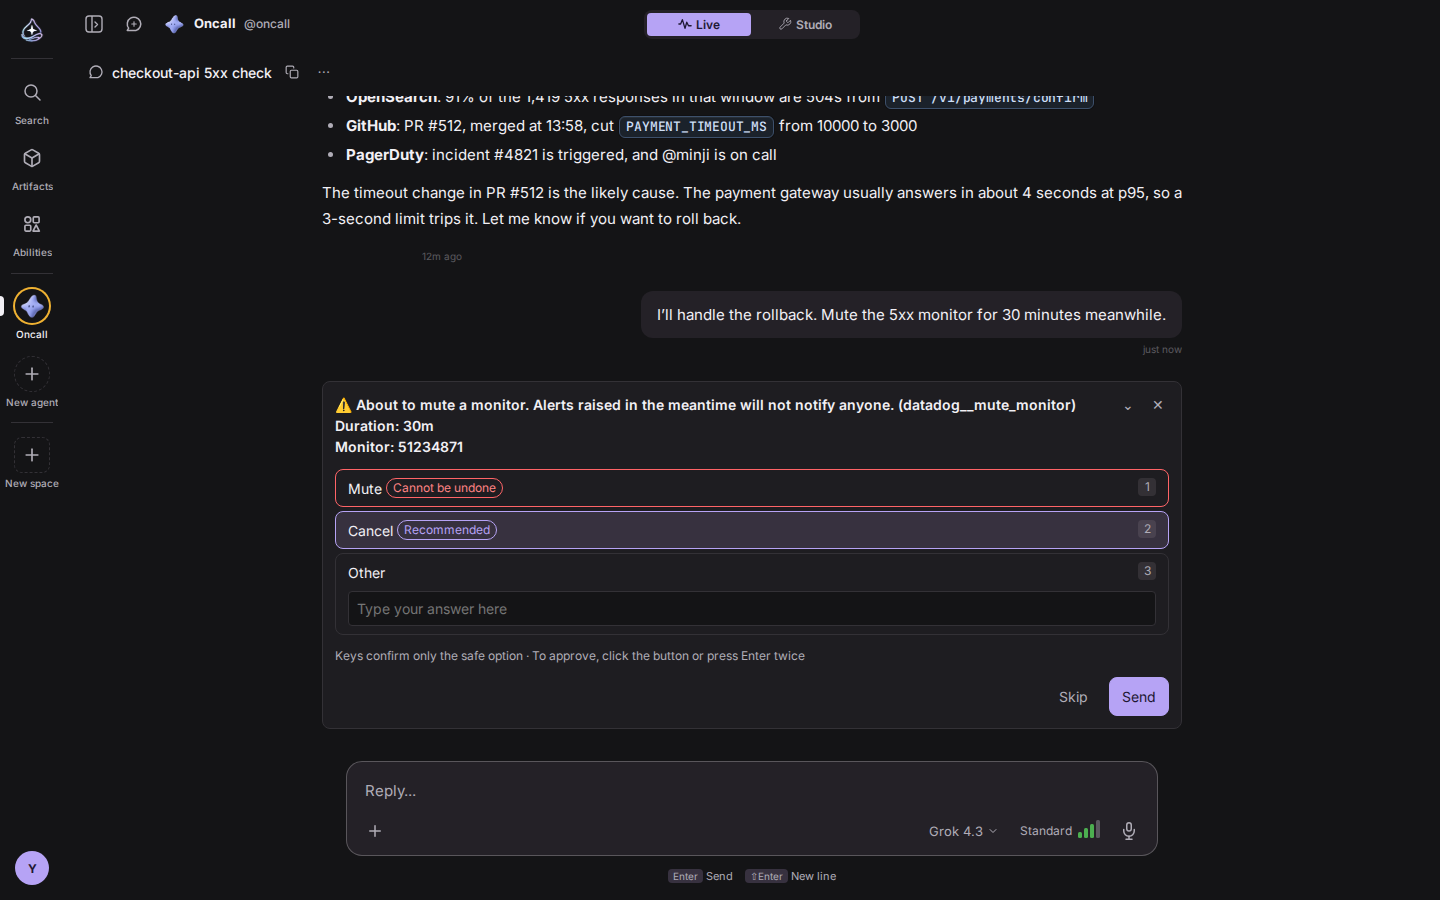
Among the monitoring tools, these actions go through approval.
- Muting a Datadog monitor, silencing a Grafana alert
- Acknowledging, resolving, or adding a note to a PagerDuty incident
- Resolving or ignoring a Sentry issue, acknowledging or closing a New Relic issue
Sending a Slack message and creating a GitHub issue go through the same card.
Running it day to day
- A morning check: tell the agent “run this check every weekday at 9 AM” in chat and you can turn it into a routine. Nobody is watching a routine run, so anything that needs approval, like a mute, is skipped, and the result says it was skipped.
- Look at the status first: when a key expires or its permissions change, the status in the connector list changes too. If the agent seems stuck on one particular tool, start there.